Total of values in Highcharts

Total of values in Highcharts

carrarachristophecarrarachristophe Posts: 100Questions: 24Answers: 2

Link to test case:
Debugger code (debug.datatables.net):
Error messages shown:
Description of problem:

Hello,
I am using Highcharts and am able to display the Datatable data in a pie chart.
What I am trying to do now is to add the total number of records displayed in the datatable somewhere in the Highcharts.
There are a couple of Stackoverflow cases like this one or that one and this is a working example with the total in the top left corner.

I fail to do the same and only get the following: Total: 0.
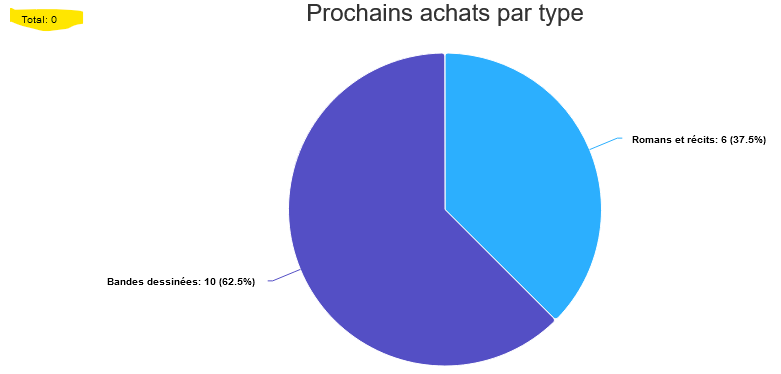
Here is my code

    var chart_type = Highcharts.chart("container_type", {
        chart: {
            type: 'pie',
            events: {
                load: function(event) {
                    var total = 0; // get total of data
                    for (var i = 0, len = this.series[0].yData.length; i < len; i++) {
                        total += this.series[0].yData[i];
                    }
                    var text = this.renderer.text(
                        'Total: ' + total,
                        this.plotLeft,
                        this.plotTop - 20
                    ).attr({
                        zIndex: 5
                    }).add() // write it to the upper left hand corner              }
                }
            },
        title: {
            text: 'Prochains achats par type',
            align: 'center',
            style: {
                font: '24px "Helvetica Neue", Helvetica, Arial, sans-serif'
            }
        },
        series: [
            {
                data: chartData_type(table),
                name: 'Voeux',
            },
        ],
        plotOptions: {
            pie: {
                allowPointSelect: true,
                cursor: 'pointer',
                dataLabels: {
                    enabled: true,
                    format: '<b>{point.name}</b>: {point.y} ({point.percentage:.1f}%)',
                    style: {
                        font: '14px "Helvetica Neue", Helvetica, Arial, sans-serif'
                    }
                }
            }
        }
    });

function chartData_type(table) {
    var counts = {};
 
    // Count the number of entries for each position
    table
        .column(4, { search: 'applied' })
        .data()
        .each(function (val) {
            if (counts[val]) {
                counts[val] += 1    ;
            } else {
                counts[val] = 1;
            }
        });
 
    // And map it to the format highcharts uses
    return $.map(counts, function (val, key) {
        return {
            name: key,
            y: val,
        };
    });
}

Any idea of what is wrong?

This question has an accepted answers - jump to answer

Answers

  • kthorngrenkthorngren Posts: 20,425Questions: 26Answers: 4,794
    edited July 2023

    I'm guessing this is the code in question:

                events: {
                    load: function(event) {
                        var total = 0; // get total of data
                        for (var i = 0, len = this.series[0].yData.length; i < len; i++) {
                            total += this.series[0].yData[i];
                        }
                        var text = this.renderer.text(
                            'Total: ' + total,
                            this.plotLeft,
                            this.plotTop - 20
                        ).attr({
                            zIndex: 5
                        }).add() // write it to the upper left hand corner              }
                    }
                },
    

    Doesn't look like there is anything Datatables specific in the code or question. You might be getting the data from Datatables but the question is specific to Highcharts. I would first start by debugging the function to find out what this.series[0] contains. From there you should be able to determine what you need to use to get the data total. You will need to refer to Highcharts docs, the Highcharts forum and/or Stack Overflow for Highcharts specific questions.

    Maybe load isn't the correct event depending on when the cart is initially created. Maybe you need another event like redraw.

    Kevin

  • carrarachristophecarrarachristophe Posts: 100Questions: 24Answers: 2

    Hi Kevin,
    Thanks for your message.

    I guess this is the part that was missing in my code above, and that is drawing the Highchart based on the Datatable:

        // On each draw, update the data in the chart
        table.on('draw', function () {
            chart_type.series[0].setData(chartData_type(table));
        });
    

    I activated the Highcharts debugger but not getting any error message.

  • allanallan Posts: 61,972Questions: 1Answers: 10,160 Site admin

    Please link to a test case showing the issue so we can take a look.

    Allan

  • carrarachristophecarrarachristophe Posts: 100Questions: 24Answers: 2
    Answer ✓

    Dear Kevin and Allan,

    Thanks a lot for your help.
    I found this interesting post and was able to solve my issue with below code.

        var chart_type = Highcharts.chart("container_type", {
            chart: {
                type: 'pie',
                events: {
                    render: function() {
                    let series = this.series
                    let sum = 0
                    for(let i = 0; i < series.length; i++) {
                        if(series[i].visible){
                        for(let j = 0; j < series[i].data.length; j++) {
                            sum += series[i].data[j].y
                        }
                      }
                    }
                    this.setTitle({text: Highcharts.numberFormat(sum, 0,","," ") + " prochains achats par type"}, false, false) 
                    }
                }
            },
            title: {
                align: 'center',
                style: {
                    font: '24px "Helvetica Neue", Helvetica, Arial, sans-serif'
                }
            },
    

    Basically it includes render (no need of load or redraw) and the setTitle function, and only styling in the title part as the title is defined in the chart/events part.

Sign In or Register to comment.